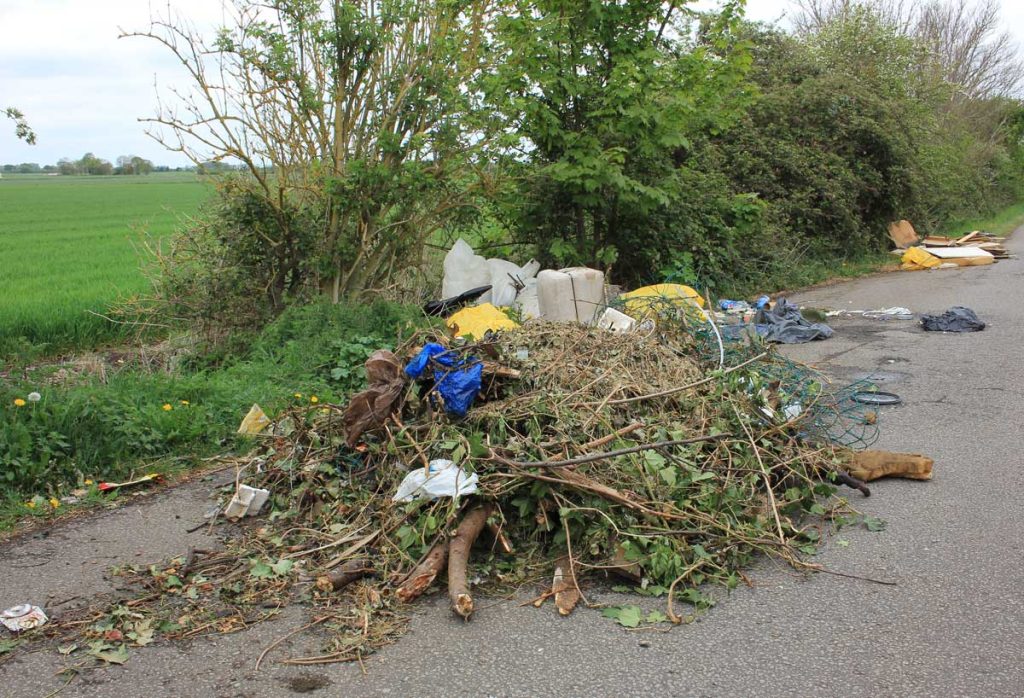
The latest flytipping statistics for 2023/24 show that Peterborough has the highest levels of fly-tipping ever recorded. The city remains in the top 25 in the country and ranks sixth outside London for incidents per 1,000 people, out of nearly 300 local authorities. Statistics published by Peterborough City Council show that April 2024 was the worst month on record, with 1,085 incidents reported. The city is also the worst location for fly-tipping in the East of England, so the situation is dire. It wasn’t always like this, though. Let’s take a deeper dive into the statistics.
From April 2023 to March 2024, the statistics show that there were 10,128 incidents recorded in Peterborough, but only 102 fines issued specifically for fly-tipping and six prosecutions. That is tiny in proportion to the size of the problem. The statistics also show that the council spent over £100K cleaning up after fly-tippers, possibly much more. Remember, it’s your council tax that is paying to clean up after these criminals
Please note that this only includes fly-tipping on local authority land; it does not include fly-tipping on private land, large-scale incidents dealt with by the Environment Agency, those cleaned up by volunteers, or those that go unreported so in reality, the figure is likely to be much higher. The Country Land and Business Association (CLA) said that nearly two-thirds of landowners and farmers have been impacted by fly-tipping. CLA Regional Director Ann Maidment commented: “Fly-tipping is a crime that’s blighting rural communities, with incidents on private land going unrecorded on a mass scale.” Across England, in the same time period, there were over one million incidents recorded, with London seeing some of the worst levels of fly-tipping in the UK..
| Place | Year | Local Authority name | Region | Total Incidents | Incidents per 1,000 people |
| 1 | 2023-24 | City of London | London | 2315 | 170.15 |
| 2 | 2023-24 | Camden | London | 34786 | 160.12 |
| 3 | 2023-24 | Hackney | London | 33464 | 126.08 |
| 4 | 2023-24 | Westminster | London | 25531 | 121.19 |
| 5 | 2023-24 | Nottingham | East Midlands | 30511 | 93.25 |
| 6 | 2023-24 | Lewisham | London | 27599 | 92.39 |
| 7 | 2023-24 | Hounslow | London | 27241 | 92.27 |
| 8 | 2023-24 | Croydon | London | 35470 | 91.93 |
| 9 | 2023-24 | Brent | London | 27023 | 88.19 |
| 10 | 2023-24 | Boston | East Midlands | 5500 | 77.33 |
| 11 | 2023-24 | Merton | London | 16116 | 74.22 |
| 12 | 2023-24 | Southwark | London | 22912 | 73.09 |
| 13 | 2023-24 | Hammersmith and Fulham | London | 11877 | 63.35 |
| 14 | 2023-24 | Haringey | London | 16508 | 62.68 |
| 15 | 2023-24 | Newham | London | 19629 | 53.31 |
| 16 | 2023-24 | Newcastle-upon-Tyne | North East | 15874 | 50.63 |
| 17 | 2023-24 | Redcar and Cleveland | North East | 6983 | 50.56 |
| 18 | 2023-24 | Kensington and Chelsea | London | 7153 | 48.83 |
| 19 | 2023-24 | Pendle | North West | 4646 | 47.47 |
| 20 | 2023-24 | Harrow | London | 12609 | 47.24 |
| 21 | 2023-24 | Peterborough | East | 10128 | 45.77 |
| 22 | 2023-24 | Greenwich | London | 13516 | 45.60 |
| 23 | 2023-24 | Ealing | London | 16828 | 44.38 |
| 24 | 2023-24 | Luton | East | 10194 | 43.63 |
| 25 | 2023-24 | Southampton | South East | 10948 | 42.54 |
Outside London
| Place | Year | Local Authority name | Region | Total Incidents | Incidents per 1,000 people |
| 1 | 2023-24 | Nottingham | East Midlands | 30511 | 93.25 |
| 2 | 2023-24 | Boston | East Midlands | 5500 | 77.33 |
| 3 | 2023-24 | Newcastle-upon-Tyne | North East | 15874 | 50.63 |
| 4 | 2023-24 | Redcar and Cleveland | North East | 6983 | 50.56 |
| 5 | 2023-24 | Pendle | North West | 4646 | 47.47 |
| 6 | 2023-24 | Peterborough | East | 10128 | 45.77 |
| 7 | 2023-24 | Luton | East | 10194 | 43.63 |
| 8 | 2023-24 | Southampton | South East | 10948 | 42.54 |
| 9 | 2023-24 | Liverpool | South East | 20003 | 39.75 |
| 10 | 2023-24 | West Northamptonshire | East Midlands | 16670 | 38.17 |
Areas with similar sized populations – excluding London
| Place | Year | Local Authority name | Region | Mid population estimates |
Total Incidents | Incidents per 1,000 people |
| 1 | 2023-24 | Peterborough | East | 221283 | 10128 | 45.77 |
| 2 | 2023-24 | Luton | East | 233640 | 10194 | 43.63 |
| 3 | 2023-24 | Rochdale | North West | 231217 | 4994 | 21.60 |
| 4 | 2023-24 | North Tyneside | North East | 212705 | 4223 | 19.85 |
| 5 | 2023-24 | Solihull | West Midlands | 219710 | 3622 | 16.49 |
| 6 | 2023-24 | Tameside | North West | 236142 | 2905 | 12.30 |
| 7 | 2023-24 | Westmorland and Furness | North West | 228646 | 2214 | 9.68 |
| 8 | 2023-24 | North Somerset | South West | 221927 | 1957 | 8.82 |
| 9 | 2023-24 | Warrington | North West | 213598 | 1217 | 5.70 |
| 10 | 2023-24 | Portsmouth | South East | 213976 | 1092 | 5.10 |
Data from Fly-tipping statistics for England, 2024 to 2025
The chart below (updated with 2024-25 figures) shows that fly-tipping incidents across Peterborough have doubled over the past decade. It’s no surprise that residents are increasingly frustrated by the volume of waste on our streets, and the trend continues to rise. When combined with growing levels of litter and graffiti, it paints a worrying picture of a community in decline.
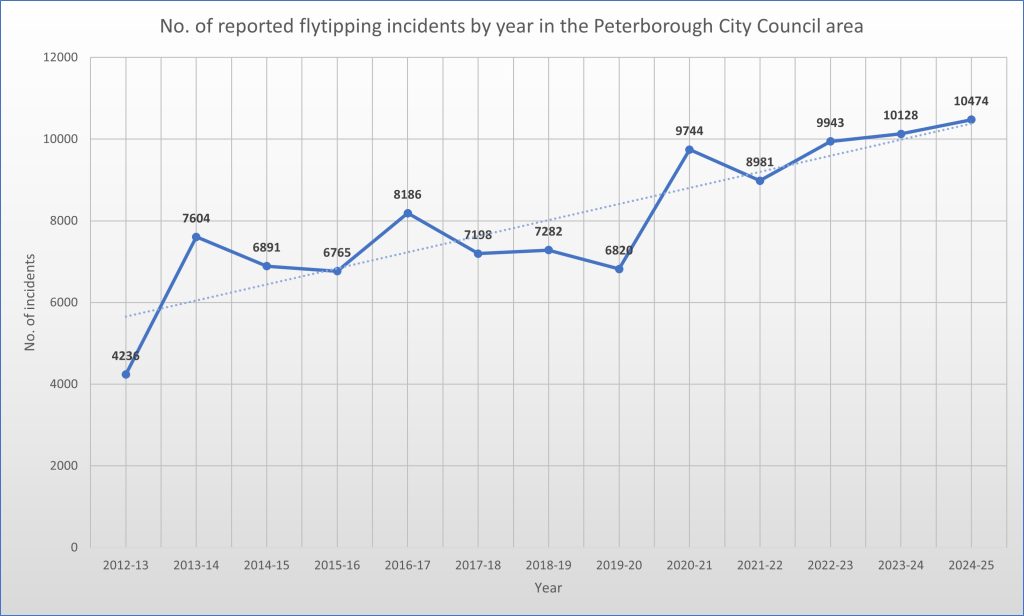
Fly-tipping statistics for England, 2024 to 2025
Out of the three parishes in our ward Newborough and Thorney being larger parishes have more of an acute problem with flytipping than Eye, but all are impacted. Virtually all of this flytipping comes from homes in the city of Peterborough, not from the villages themselves.
NFU Vice President Rachel Hallos said: ““The scale of waste crime is staggering, with nearly a fifth of all waste – an estimated 34 million tons – being handled illegally every year.”
Peterborough City Council says: “While the figures are high, it’s not a like for like comparison because they have both urban and rural areas which have historically suffered”. Other cities have both urban and rural areas, and not such high levels of flytipping. The fact remains that the city is one of the worse in the country for levels of flytipping. Councillor Julia Stevenson for Orton Waterville is a proactive councillor who cares about her ward, but saying “we’re not doing that bad” is towing the council line, not holding officers to account. Lets hope she and other councillors on the Task and Finish Group make a positive difference this time.
So why has it got so bad?
Here are some of the main reasons why it has gotten worse:
-
Increased waste disposal costs: The rising cost of legitimate waste disposal has pushed some people to take the cheaper route by illegally dumping their waste, a bit more about that below. Fees for using council-run waste sites, especially for large or commercial waste, have increased over time. Some individuals and businesses may opt for fly-tipping as a way to avoid these costs.
-
Lack of enforcement: Although fly-tipping is illegal, enforcement has been weak. Austerity meant local authorities took their eye off the ball, diverting money into other services and being reactive in regards fly tipping but not proactive. Additionally fines or penalties may not always be sufficient to deter offenders, especially when it is difficult to catch those responsible and courts see it as a low level crime so do not punish appropriately. It’s also expensive taking fly tippers to court although councils can sometimes claim those costs back. In fact the according the the Countryside Alliance fly-tipping statistics for England for 2023-24, showed a 6% rise in dumping incidents but fixed penalty notices fell by 5%, and court fines also fell by 8%.
-
Poor public awareness and lack of accountability: Some people may not realise the environmental and legal implications of fly-tipping. Others may feel that their actions won’t be noticed, especially if they dump waste in remote areas. Additionally, there’s a general lack of responsibility among certain sectors of society when it comes to proper waste disposal. Some probably just don’t care as long as the money is in their pocket.
-
Increased urbanisation and population growth: The expansion of urban areas and population growth can lead to more waste being generated. As more people move into cities and towns, there may not be enough accessible or convenient waste management services to meet demand, or sites may not have the capacity to deal with that growth leading some individuals to dump waste illegally. And increase in rental properties has also been linked to the increases in fly tipping.
-
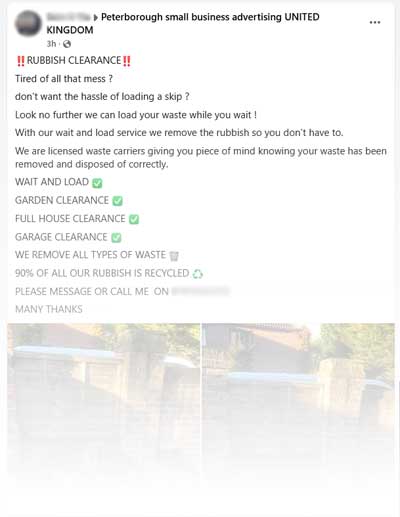
Facebook groups are awash with waste removal advertisements. Always confirm their license to operate. The rise of online services and “man with a van”: Many people use informal services, like “man with a van” companies, to remove waste. While some of these services are licensed and legitimate businesses, there are many fly-by-night operators who undercut the legal operators for waste removal and then illegally dump it, leaving their clients unaware of the law-breaking. You’ve only got to look at the city’s Market Facebook groups to see many companies advertising a waste removal services.
-
Lack of proper disposal facilities with enough capacity to deal with growing cities: In more rural parts of the UK, there may be limited access to waste disposal facilities. This could make fly-tipping an attractive option for those living outside urban areas where regular waste collection services might be less available or harder to access. To save money cash strapped councils can make it more difficult to dispose of waste, not easier.
-
Environmental changes and attitudes: There’s been a general decline in respect for the environment and local communities. Social attitudes around waste and environmental protection may not always encourage responsibility, and people might feel less connected to their surroundings, leading to a higher tolerance for illegal dumping.
-
A lack of infrastructure: Increasing population generates more waste. In some places, there simply aren’t enough facilities or services to handle the waste properly, and people are left with few choices. This can include inadequate recycling services, not enough skips for large items, or limited access to appropriate waste disposal services. In fact to deal with the issue local authorities are putting in stricter rules on what can be taken to their recycle centres and how much can be taken as it’s cheaper than increasing capacity.
So what happened?
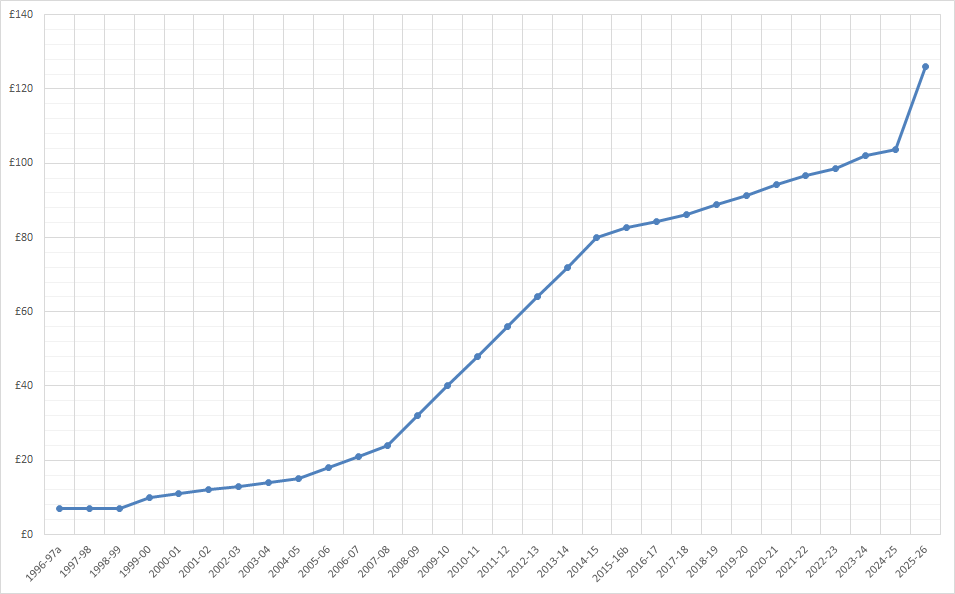
In 2007, the Countryside Alliance was already warning that the high levels of fly-tipping across the UK could reach “epidemic proportions” due to the ever-increasing cost of landfill tax. Landfill tax itself was introduced in 1996 under the Conservative government of the time to encourage waste producers and the waste management industry to switch to more sustainable methods of disposal. Since then, successive governments have also used it as a way to generate additional tax revenue under the auspices of ‘reducing landfill’. One negative side effect, of course, has been an increase in fly-tipping, as some people either refuse to pay the higher costs of proper waste disposal or instead pay illegal carriers who dispose of it cheaply by fly-tipping.
There are two rates of landfill tax: standard and lower. The lower rate applies to inactive or inert waste, such as soil, rocks, concrete, bricks, and mineral waste. The standard rate applies to everything else. In 2025 the government was looking to remove the lower rate but due to the serious impact this would have on the construction industry and the likely increase in flytipping they decided to only increase the tax line with the standard rate. This year it has meant that the cost per ton of the lower rate has doubled!
In 1996 when landfill tax was introduced the standard rate was £7 per ton, from April 2025 it saw one of the biggest increases ever to £126.15 ton, and it continues to increase year on year. You can find full details here. It does make you wonder the logic of such an increase at time when levels of flytipping are at an all time high.
What can be done?
Addressing the increases fly-tipping (and litter) in the UK requires a multi-faceted approach, including stricter enforcement, better public awareness campaigns, and improved waste management infrastructure. All that’s been lacking for many years. It’s a problem that involves not just individuals but also government bodies, businesses, and communities working together to find sustainable solutions. Like littering the problem has become so large it’s going to be difficult to put it ‘back in the bottle’. Despite the pressures on local authority funding if more proactive actions are not taken, it’s only going to get worse. What is needed is more investment and more campaigning including naming and shaming of those found guilty of fly tipping.
As individuals it’s important that we check any waste carrier has a license to remove our waste which you can do here: https://environment.data.gov.uk/public-register/view/search-waste-carriers-brokers Even builders need a license if they are transferring waste from your home during any work. More on the Eye Parish Council website. Flytipping can be reported via Fixmystreet. Additionally if you see or suspect or see someone flytipping you can report it via the same app.
Peterborough City Council has set up a task and finish group to look into the issue of fly tipping across the city. This isn’t the first time the council has done this and you can see the results of the previous group here. They have also increased the fine they can hand out to the maximum allowed by the government but still more needs to be done.
Independent Review Committee (IRC) on Debris is a group that has been setup by volunteers. The group aims is to work closely with Peterborough City Council by analysing data, identifying issues and subsequently proposing strategies and solutions.
Less reports and more actions as below please Peterborough City Council.
See our previous coverage of flytipping here.
Resources
- Peterborough City Council
- Fly-tipping statistics for England
- What to do if you’re a victim of… fly-tipping
- Countryside Alliance
- Independent Review Committee
- Peterborough Litter Wombles
Media
- Peterborough is East of England’s fly-tipping hotspot (Peterborough Matters)
- Farming in the region’s fly-tipping hotspot (NFU Online)
- City has region’s highest rate of fly-tipping (BBC)
- Fly-tipping taskforce to be introduced by council (BBC)
Any of the charts on this page are free for anyone to use in regards the impact of flytipping. This page will be kept updated as the new stats are released.