The full crime statistics for 2017 have been released on police.co.uk. For the fourth year in succession, the figures show an overall increase in recorded crime across the parish.
In 2012 the figure was 351 recorded crimes for the whole year. Last year the figure had risen to 578, a 65 per cent increase.
| 2015 | 2016 | 2017 | ||||||||
|---|---|---|---|---|---|---|---|---|---|---|
| Crime type | Total | % | Total | % | Change | Total | % | Change | ||
| Anti-social behaviour | 178 | 42.1% | 156 | 29.7% | -12.4% | 139 | 24% | -10.9% | ||
| Bicycle theft | 4 | 0.9% | 5 | 0.9% | 25% | 2 | 0.3% | -60% | ||
| Burglary | 26 | 6.1% | 48 | 9.1% | 84.6% | 54 | 9.3% | 12.5% | ||
| Criminal damage and arson | 48 | 11.3% | 46 | 8.8% | -4.2% | 43 | 7.4% | -6.5% | ||
| Drugs | 7 | 1.6% | 6 | 1.1% | -14.3% | 3 | 0.5% | -50% | ||
| Other crime | 10 | 2.4% | 7 | 1.3% | -30% | 7 | 1.2% | 0% | ||
| Other theft | 24 | 5.0% | 74 | 14.1% | 208.3% | 69 | 11.9% | -6.8% | ||
| Possession of weapons | 0 | 0% | 2 | 0.4% | 200% | 1 | 0.2% | -50% | ||
| Public order | 3 | 0.7% | 13 | 2.5% | 333.3% | 22 | 3.8% | 69.2% | ||
| Robbery | 9 | 2.1% | 4 | 0.8% | -55.6% | 3 | 0.5% | -25% | ||
| Shoplifting | 11 | 2.6% | 28 | 5.3% | 154.5% | 70 | 12.1% | 150% | ||
| Theft from the person | 3 | 0.7% | 2 | 0.4% | -33.3% | 2 | 0.3% | 0% | ||
| Vehicle crime | 33 | 7.8% | 46 | 8.8% | 39.4% | 42 | 7.3% | -8.7% | ||
| Violence and sexual offences | 67 | 15.8% | 88 | 16.8% | 31.3% | 121 | 20.9% | 37.5% | ||
| Total | 423 | 525 | 24.1% | 578 | 10.1% |
Comparison of crime types in the parish from January to December 2017:
* Data area: https://www.police.uk/cambridgeshire/Peterborough/crime/+VPVKZ4
 Anti-social behaviour continues to be a problem but the largest increase for 2017 has been in shoplifting. In 2015 there were 11 recorded crimes, in 2017 there have been 70. More worryingly is the increase in violent and sexual offences which have increased from 67 in 2015 to 121 last year. On a similar theme burglary is also on the increase, more than doubling from 26 in 2015 to 54 in 2017.
For the whole of Cambridgeshire in 2013, 5443* burglaries were reported, by 2017 there are an additional thousand burglaries are recorded.
| 2013 | 2014 | 2015 | 2016 | 2017 | |
|
Number of recorded burglaries
|
5443 | 5195 | 5777 | 5099 | 6458 |
|
Number of burglaries where one or more suspects had been identified
|
858 | 794 | 801 | 788 | 912 |
|
Number of persons charged/summonsed
|
459 | 437 | 362 | 371 | 370 |
* Figures from a freedom of information received by Cambridgeshire Police in January 2018 for burglaries reported to Cambridgeshire police.
If you are burgled there is some help here: https://www.safewise.com/home-security-faq/house-break-in
There may be some discrepancy in the figures due to the way crimes are recorded. Last year the Peterborough Telegraph reported that from 1 March 2016 to 31 August 2016 inspectors estimated more than reported 7,000 crimes were not recorded properly.
So what’s the cause?
It’s hard to pin down a single factor. As the village population increases crimes are also likely to increase but there has been a significant increase across Peterborough as reported in the Peterborough Telegraph in February 2018: Big rise in burglaries and other crimes recorded in Peterborough.
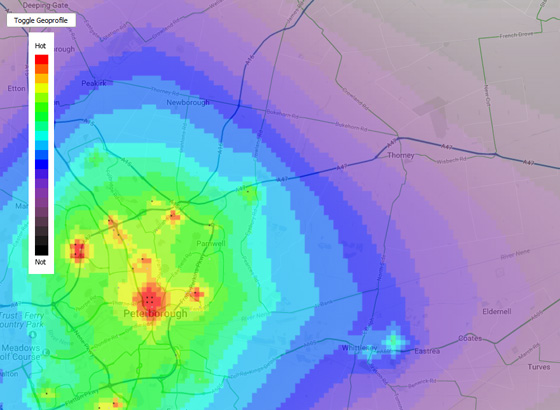
Heatmap from http://geographicprofiler.com/crimes/uk-police/cambridgeshire-constabulary
In 2017 it was reported that Cambridgeshire Police have a budget deficit of nearly £10 million over the next three years. and there has been a 17 per cent reduction in the workforce since 2010. The county also has some of the highest levels of 999 and 101 calls in the country, between 190,000 and 210,000 incidents per year. The county also receives below the national average funding and so has fewer officers per head of population compared to the national average.
Reporting crimes
All crimes however small should be reported. There is a special number for non-urgent crimes. Further information here. We have some information on how to protect your property here.
Victim Support helps people affected by crime or traumatic events get the support they need and the respect they deserve: www.victimsupport.org.uk.
Related pages